Reading and Writing Excel Files in Python - Part 2

Excel Introduction
Excel is a spreadsheet software developed by Microsoft for Windows and macOS operating systems. With its intuitive interface, excellent calculation functions and chart tools, plus successful marketing, Excel has always been the most popular personal computer data processing software. Of course, Excel also has many competitors, such as Google Sheets, LibreOffice Calc, Numbers, etc. These competitors can basically be compatible with Excel, at least they can read and write newer versions of Excel files, but of course these are not the focus of our discussion. Mastering how to operate Excel files with Python programs can make daily office automation work easier and more pleasant, and in many commercial projects, importing and exporting Excel files are particularly common functions.
In this chapter, we continue to explain how to perform Excel file operations based on another third-party library openpyxl. First, you need to install it.
pip install openpyxlThe advantage of openpyxl is that when we open an Excel file, we can both read and write to it, and it is more convenient to operate than xlwt and xlrd. In addition, if you want to do style editing and formula calculation, using openpyxl is much simpler than the methods we explained in the previous chapter. Moreover, openpyxl also supports operations such as pivot tables and inserting charts, making it very powerful. One point needs to be emphasized again: openpyxl does not support operating Excel files from versions before Office 2007.
Reading Excel Files
For example, if there is an Excel file named “Alibaba 2020 Stock Data.xlsx” in the current folder, if you want to read and display the contents of the file, you can complete it through the code shown below.
import datetime

import openpyxl

# Load a workbook ---> Workbook
wb = openpyxl.load_workbook('Alibaba 2020 Stock Data.xlsx')
# Get the names of worksheets
print(wb.sheetnames)
# Get worksheet ---> Worksheet
sheet = wb.worksheets[0]
# Get the range of cells
print(sheet.dimensions)
# Get the number of rows and columns
print(sheet.max_row, sheet.max_column)

# Get the value of a specified cell
print(sheet.cell(3, 3).value)
print(sheet['C3'].value)
print(sheet['G255'].value)

# Get multiple cells (nested tuples)
print(sheet['A2:C5'])

# Read all cell data
for row_ch in range(2, sheet.max_row + 1):
    for col_ch in 'ABCDEFG':
        value = sheet[f'{col_ch}{row_ch}'].value
        if type(value) == datetime.datetime:
            print(value.strftime('%Y-%m-%d'), end='\t')
        elif type(value) == int:
            print(f'{value:<10d}', end='\t')
        elif type(value) == float:
            print(f'{value:.4f}', end='\t')
        else:
            print(value, end='\t')
print()Tip: The Excel file “Alibaba 2020 Stock Data.xlsx” used in the above code can be obtained through the Baidu Cloud link below. Link: https://pan.baidu.com/s/1rQujl5RQn9R7PadB2Z5g_g Extraction code: e7b4.
It should be reminded that openpyxl has two ways to get a specified cell. One is through the cell method. Note that the row index and column index of this method both start from 1, which is to accommodate people who are used to Excel. The other is through index operations, by specifying the coordinates of the cell, such as C3, G255, to get the corresponding cell. Then through the value attribute of the cell object, you can get the value of the cell. Through the above code, I believe you also noticed that you can get multiple cells through slicing operations like sheet['A2:C5'] or sheet['A2':'C5']. This operation will return nested tuples, which is equivalent to getting multiple rows and columns.
Writing Excel Files
Below we use openpyxl to perform Excel write operations.
import random

import openpyxl

# Step 1: Create a workbook (Workbook)
wb = openpyxl.Workbook()

# Step 2: Add a worksheet (Worksheet)
sheet = wb.active
sheet.title = 'Final Exam Scores'

titles = ('Name', 'Chinese', 'Math', 'English')
for col_index, title in enumerate(titles):
    sheet.cell(1, col_index + 1, title)

names = ('Guan Yu', 'Zhang Fei', 'Zhao Yun', 'Ma Chao', 'Huang Zhong')
for row_index, name in enumerate(names):
    sheet.cell(row_index + 2, 1, name)
    for col_index in range(2, 5):
        sheet.cell(row_index + 2, col_index, random.randrange(50, 101))

# Step 4: Save the workbook
wb.save('Exam Scores.xlsx')
Adjusting Styles and Formula Calculation
When using openpyxl to operate Excel, if you want to adjust the style of cells, you can directly operate through the properties of the cell object (Cell object). The properties of cell objects include font (font), alignment (alignment), border (border), etc. For details, you can refer to the official documentation of openpyxl. When using openpyxl, if you need to do formula calculations, you can completely follow the operation method in Excel. The specific code is shown below.
import openpyxl
from openpyxl.styles import Font, Alignment, Border, Side

# Alignment
alignment = Alignment(horizontal='center', vertical='center')
# Border line
side = Side(color='ff7f50', style='mediumDashed')

wb = openpyxl.load_workbook('Exam Scores.xlsx')
sheet = wb.worksheets[0]

# Adjust row height and column width
sheet.row_dimensions[1].height = 30
sheet.column_dimensions['E'].width = 120

sheet['E1'] = 'Average Score'
# Set font
sheet.cell(1, 5).font = Font(size=18, bold=True, color='ff1493', name='KaiTi')
# Set alignment
sheet.cell(1, 5).alignment = alignment
# Set cell border
sheet.cell(1, 5).border = Border(left=side, top=side, right=side, bottom=side)
for i in range(2, 7):
    # Formula to calculate each student's average score
    sheet[f'E{i}'] = f'=average(B{i}:D{i})'
    sheet.cell(i, 5).font = Font(size=12, color='4169e1', italic=True)
    sheet.cell(i, 5).alignment = alignment

wb.save('Exam Scores.xlsx')
Generating Statistical Charts
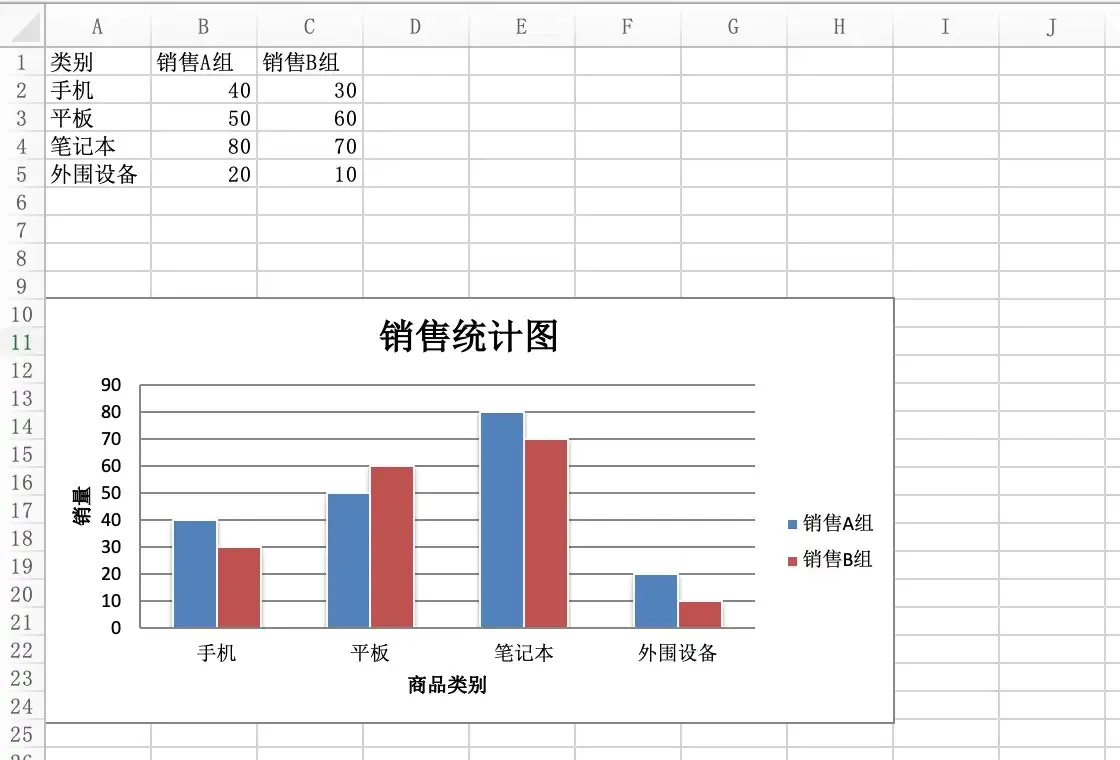
Through the openpyxl library, you can directly insert statistical charts into Excel. The specific approach is generally consistent with inserting charts in Excel. We can create a chart object of a specified type, and then set the chart through the properties of this object. Of course, the most important thing is to bind data to the chart, that is, what the horizontal axis represents, what the vertical axis represents, and what the specific values are. Finally, you can add the chart object to the sheet. The specific code is shown below.
from openpyxl import Workbook
from openpyxl.chart import BarChart, Reference

wb = Workbook(write_only=True)
sheet = wb.create_sheet()

rows = [
    ('Category', 'Sales Team A', 'Sales Team B'),
    ('Phones', 40, 30),
    ('Tablets', 50, 60),
    ('Laptops', 80, 70),
    ('Peripherals', 20, 10),
]

# Add rows to the sheet
for row in rows:
    sheet.append(row)

# Create chart object
chart = BarChart()
chart.type = 'col'
chart.style = 10
# Set chart title
chart.title = 'Sales Statistics Chart'
# Set the title of the chart's vertical axis
chart.y_axis.title = 'Sales Volume'
# Set the title of the chart's horizontal axis
chart.x_axis.title = 'Product Category'
# Set the data range
data = Reference(sheet, min_col=2, min_row=1, max_row=5, max_col=3)
# Set the category range
cats = Reference(sheet, min_col=1, min_row=2, max_row=5)
# Add data to the chart
chart.add_data(data, titles_from_data=True)
# Set categories for the chart
chart.set_categories(cats)
chart.shape = 4
# Add the chart to the specified cell in the sheet
sheet.add_chart(chart, 'A10')

wb.save('demo.xlsx')
Running the above code and opening the generated Excel file, the effect is shown in the figure below.
Summary
Mastering the method of operating Excel with Python programs can solve many tedious tasks of processing Excel spreadsheets in daily office work. The most common is merging multiple Excel files with the same data format into one file and extracting specified data from multiple Excel files or sheets. If the data volume is large or the way of processing data is relatively complex, we still recommend using pandas, one of Python’s data analysis tools.